Lab – Configure Application Layer DoS Defenses
Check out how to detect and mitigate application layer attacks, not matter if it’s encrypted or behavioral based.
Create Protected Object for Behavioral DoS Protection
In the BIG-IP Configuration Utility, open the DoS Protection-> Quick Configuration page and in the Protected Objects section click Create.
Configure the protected object Server1-http using the following information:
Name: Server1-http IP Address: 10.1.20.11/32 Port: 80 VLAN: defaultVLAN Protec. Settings Action: Log and Mitigate Protec. Settings Silverline: Yes (selected) Protec. Settings DDoS: IPv4, TCP, HTTP In the HTTP row click the + icon, and then click Behavioral, then from the Mitigation list select Standard Protection.
In the HTTP section click Proactive Bot Defense, then from the Mitigate Action list select Disabled, finally click Create
Note
Both the good and bad (attack) traffic are generated with tools that would be blocked by Proactive Bot Defense. Please note that by default, the Hybrid Defender will set Proactive Bot Defense to always’. That’s the reason why we’re disabling it, only to allow the scripts to work and generate sample traffic.
In the Protected Objects section click Create.
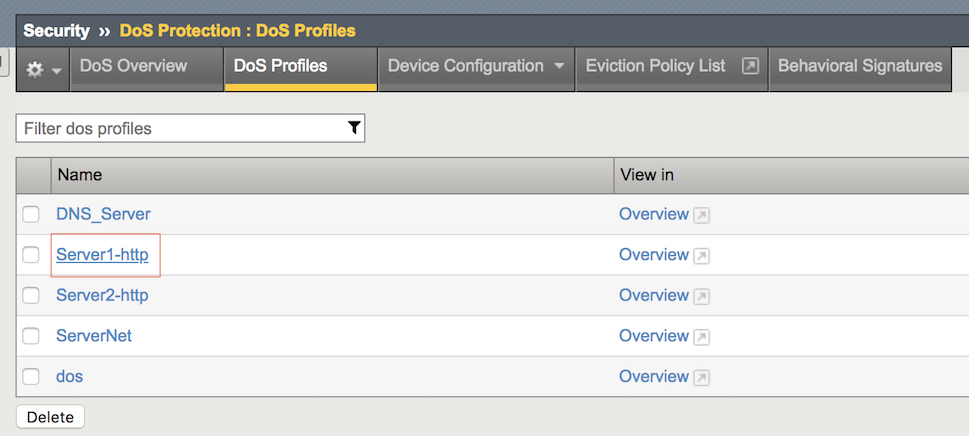
Open the Security-> DoS Protection-> DoS Profiles page and click Server1-http.
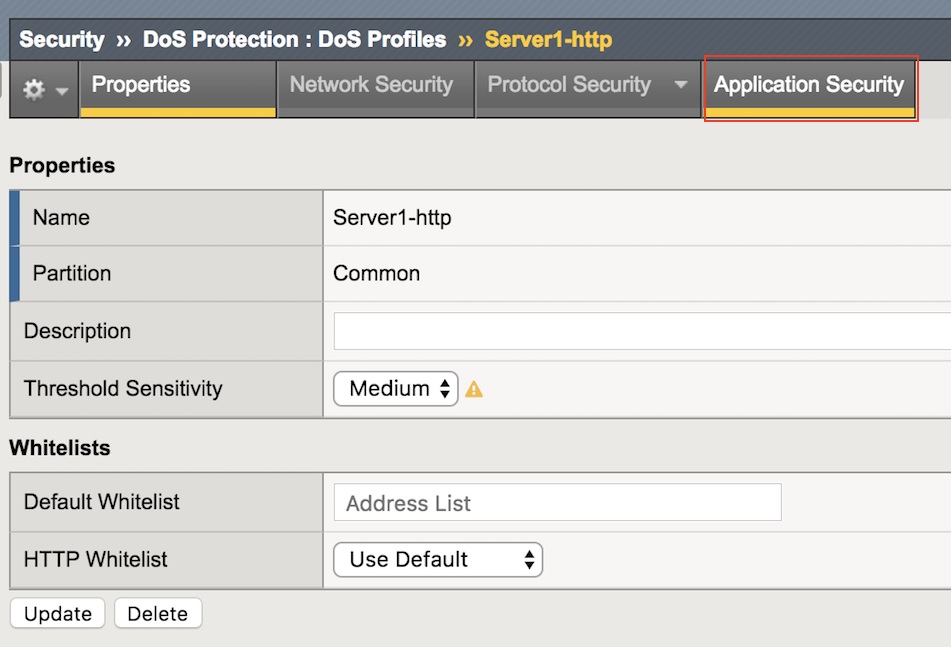
Open the Application Security page.
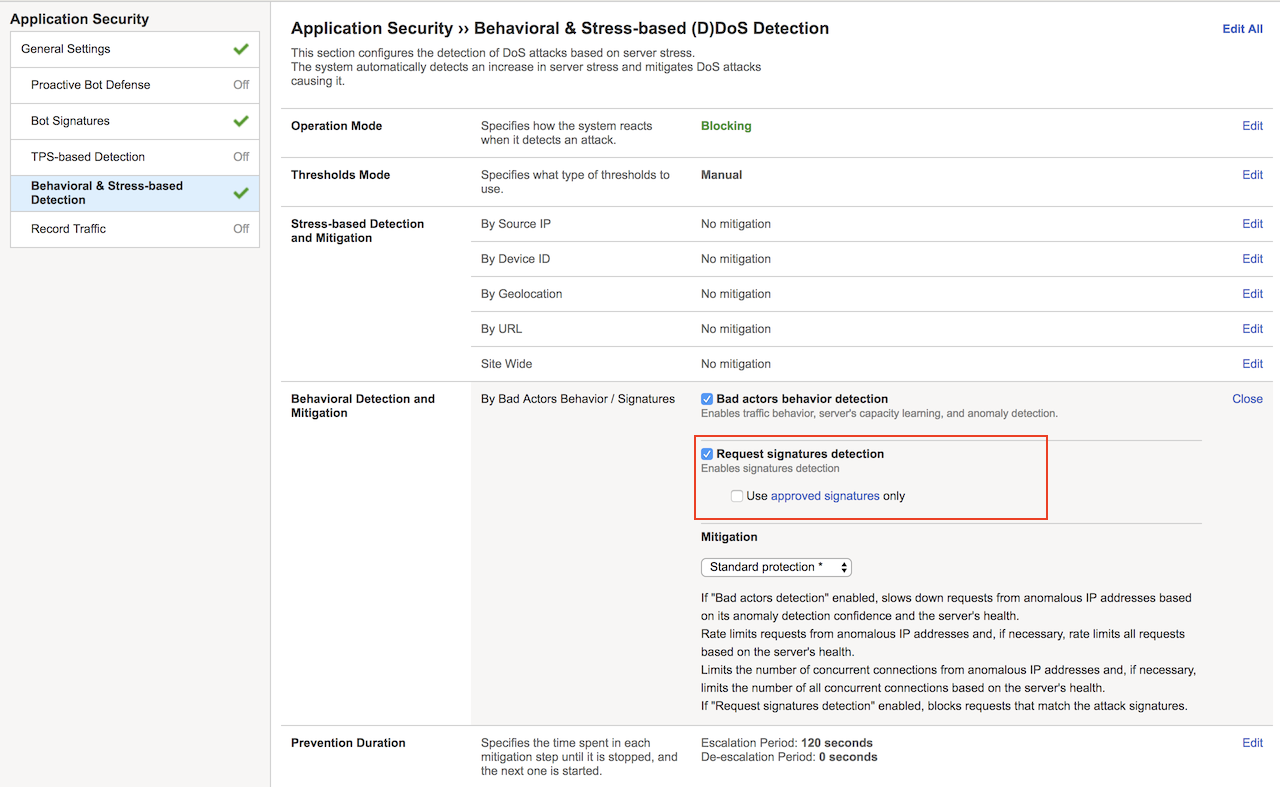
Click Behavioral & Stress-based Detection, and then for Behavioral Detection and Mitigation click Edit.
Select the Request signatures detection checkbox, and then click Update.
Generate L7 Behavioral baseline for Server1-http
Use a script to generate an L7 behavioral DoS baseline for the Hybrid Defender.
In the goodclient terminal session, type (or copy and paste) the following command:
sudo ~/tools_agility_183/generate_clean_traffic.shNote
This will generate traffic. Please note that it will take at least 15 minutes.
f5student@goodclient:~/tools_agility_183$ ./generate_clean_traffic.sh
welcome.php     status: 200     bytes: 1045     time: 0.017
welcome.php     status: 200     bytes: 1045     time: 0.014
welcome.php     status: 200     bytes: 1045     time: 0.014
welcome.php     status: 200     bytes: 1045     time: 0.015
headers.php     status: 200     bytes: 1847     time: 0.014
headers.php     status: 200     bytes: 1847     time: 0.014
httprequest.php status: 200     bytes: 710      time: 0.013
httprequest.php status: 200     bytes: 710      time: 0.014
httprequest.php status: 200     bytes: 710      time: 0.014
httprequest.php status: 200     bytes: 710      time: 0.013
badlinks.html   status: 200     bytes: 1270     time: 0.014
badlinks.html   status: 200     bytes: 1270     time: 0.014
F5_building.jpg status: 200     bytes: 33447    time: 0.019
F5_building.jpg status: 200     bytes: 33447    time: 0.021
bigip4200.jpg   status: 200     bytes: 9753     time: 0.016
bigip4200.jpg   status: 200     bytes: 9753     time: 0.017
viprion2400.jpg status: 200     bytes: 13009    time: 0.016
viprion4800.jpg status: 200     bytes: 10078    time: 0.018
viprion4800.jpg status: 200     bytes: 10078    time: 0.017
Move on in the exercises while the baseline is being generated.
Open a terminal session with the DHD and run the following command:
admd -s vs./Common/Server1-http.info -s vs./Common/Server1-http.sig.health[root@dhd-01:Active:Standalone]# admd -s vs./Common/Server1-http.info -s vs./Common/Server1-http.sig.health vs./Common/Server2-http.sig.health:[0.452373] vs./Common/Server2-http.sig.health:[0.453407] vs./Common/Server2-http.sig.health:[0.451726] vs./Common/Server2-http.sig.health:[0.45372] vs./Common/Server2-http.sig.health:[0.452021] vs./Common/Server2-http.sig.health:[0.45349]Important
The results for each health check should not be 0.5, otherwise the system ins’t learning. Let both terminal sessions opened for the rest of this lab.
Configure DoS Protection for L7 Encrypted Traffic
Launch an encrypted Slowloris attack to the web server and view the results, then configure proper mitigation on the Hybrid Defender.
Go to DoS Protection-> Quick Configuration page and in the Protected Objects section click Create.
Configure another Protected Object using the following information, and then click Create.
Name: Server2-http IP Address: 10.1.20.12/32 Port: 80 VLAN: defaultVLAN Protec. Settings Action: Log and Mitigate Protec. Settings Silverline: Yes (selected) Protec. Settings DDoS: IPv4, TCP, HTTP Now repeat the steps for disabling the Proactive Bot Defense which allows the HTTP request scripts to work.
Go to the HTTP section and click Proactive Bot Defense, then from the Mitigate Action list select Disabled.
In the HTTP section click DoS Tool, then from the Mitigate Action list select Report, and then click Create.
Now run the monitor script on server2 as follows. It will be usefull for server health monitoring.
~/tools_agility_183/server2_monitor.shBefore launching the application layer attack, observe server2 is currently healthy.
welcome.php     status: 200 bytes: 1045     time: 0.018
bigtext.html    status: 200 bytes: 634965   time: 0.136
httprequest.php status: 200 bytes: 710      time: 0.017
Note
The system is healthy since the web server returns HTTP Status Code 200 for every request.
Now from the attacker terminal session run the following command:
~/tools_agility_183/slowloris.shMon Aug 13 11:26:54 2018: slowhttptest version 1.6 - https://code.google.com/p/slowhttptest/ - test type: SLOW HEADERS number of connections: 4090 URL: https://server2.f5demo.com/ verb: GET Content-Length header value: 4096 follow up data max size: 68 interval between follow up data: 10 seconds connections per seconds: 200 probe connection timeout: 5 seconds test duration: 240 seconds using proxy: no proxy Mon Aug 13 11:26:54 2018: slow HTTP test status on 30th second: initializing: 0 pending: 1790 connected: 150 error: 0 closed: 2092 service available: **NO**Observe how the service is impacted as the slowloris attack hits the server2.f5demo.com.
welcome.php     status: 000 bytes: 0    time: 1.002
bigtext.html    status: 000 bytes: 0    time: 1.002
httprequest.php status: 000 bytes: 0    time: 1.002
Note
Since the slowloris attack is being encrypted (https://server2.f5demo.com) we need to setup the certificate and private keys so the traffic can be inspected by the Hybrid Defender..
Configure SSL on the protected object to in order to inspect HTTPS traffic.
Go to DDoS Protection-> Quick Configuration-> Protected Objects, then click Server2-http. Configure the SSL as follows:
Port: 443 SSL: Enabled SSL Certificate: default Key: default Encrypt Connection to Server: Yes (selected) Disable bot protections so the scripts can be used for testing the server health.
On the Server2-http Protected Object section go to the HTTP row, click the + icon, click Behavioral
Now from the Mitigation list select Standard Protection.
In the HTTPS section click Proactive Bot Defense, then from the Mitigate Action list select Disabled.
Now that SSL is also being inspected for this Protected Object, let’s run the slowloris script once again and verify if the attack still works.
– Behavioral L7 DoS Mitigation
Once the L7 behavioral baseline has been established, launch an L7 DoS attack and view the results.
Now get back to the DHD terminal session.
You will need to observe the info.learning signature to ensure that the system has accumulated enough learning details.
This signature has 4 comma-separated values for monitoring the learning progress:
- Value #1: baseline-learning_confidence
This should be between 80 - 90%
- Value #2: learned_bins_count (the number of learned bins)
This should be > 0
- Value #3: good_table_size (the number of learned requests)
This should be > 4000
- Value #4: good_table_confidence (how confident, as a percentage, the system is)
It must be 100% for behavioral signatures
vs./Common/Server1-http.info.learning:[96.3163, 78, 5355, 100]If you see the pattern such as that described, it indicates the traffic baseline was already established, then you can move forward with the lab.
Once the info.learning values are acceptable based on the details above, from the attacker terminal session run the following command:
~/tools_agility_183/http_flood.shSelect option “1”
Now take a look at the goodclient terminal session, you should start seeing the effects of the HTTP DoS attack, as requests are starting to fail (HTTP Status Code 000). If you were to examine the Lamp server at this time, you would see that it is under severe stress.
welcome.php status: 200     bytes: 1045     time: 0.017
welcome.php status: 200     bytes: 1045     time: 0.029
welcome.php status: 000     bytes: 0        time: 1.000
headers.php status: 000     bytes: 0        time: 1.001
headers.php status: 200     bytes: 1847     time: 0.204
headers.php status: 200     bytes: 1847     time: 0.258
headers.php status: 200     bytes: 1847     time: 0.218
badlinks.html       status: 000     bytes: 0        time: 1.001
badlinks.html       status: 200     bytes: 1270     time: 0.242
badlinks.html       status: 200     bytes: 1270     time: 0.272
badlinks.html       status: 000     bytes: 0        time: 1.002
bigip4200.jpg       status: 200     bytes: 9318     time: 0.247
Also from the DHD terminal session watch the health signal feed. You should see it climb from ~.5, which is optimal health, to values over 1, indicating an increase in server stress. You will also be able to watch as the system responds and mitigations are engaged.
When the system has analyzed the attack traffic, dynamic signatures are created and engaged:
vs./Common/Server1-http.sig.health:[0.768427]
vs./Common/Server1-http.info.attack:[1, 1]
vs./Common/Server1-http.sig.health:[0.746648]
vs./Common/Server1-http.info.signature:["Stable signature detected: (http.f5_filename_bin == 21) and (http.request.method eq \"GET\") and (!(http.user_agent matches \"(MSIE|Chrome|Firefox|Opera|Safari|Maxthon|Seamonkey)\")) and (!http.content_type) and ((http.hdr_len->= 128) and (http.hdr_len < 256)) and (http.request.uri matches \"^[^\\\\?]*$\") and (http.f5_headers_count == 5) and (http.f5_cache_control_bin == 0) and (http.accept) and (http.request.line matches \"Accept-Charset:.*\") and (http.f5_host_bin == 4) and (http.f5_referer_bin == 0) and (http.f5_uri_len_bin == 0) and (!(http.accept matches \"(application|audio|message|text|image|multipart)\")) and (http.connection) and (http.host) and (!(http.request.line matches \"Accept-Charset\")) and (http.user_agent)"]
vs./Common/Server1-http.info.attack:[1, 1]
vs./Common/Server1-http.sig.health:[0.726608]
vs./Common/Server1-http.info.attack:[1, 1]
vs./Common/Server1-http.sig.health:[0.709827]
vs./Common/Server1-http.info.attack:[1, 1]
vs./Common/Server1-http.sig.health:[0.691779]
In the Configuration Utility, notice the indicator at the top-left side of the page.
As you watch the feed, you should see HTTP requests being served again after the dynamic signature kicks in.
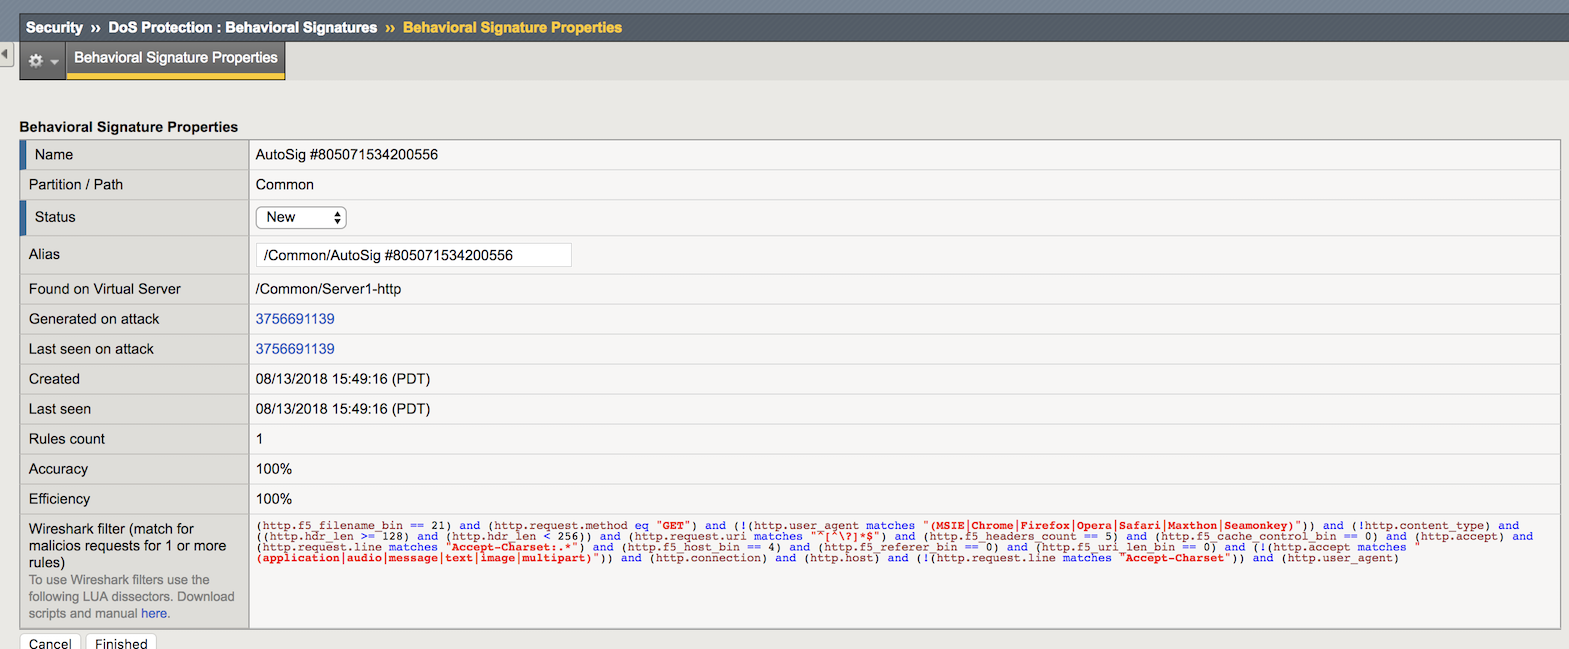
In the Configuration Utility open the Security-> DoS Protection-> Behavioral Signatures page.
You will see a signature that was created (as seen in the output of the
admdcommand earlier). Note the system reports metrics such as Accuracy (an estimate of the percentage of traffic that will be blocked that is definitely hostile) and Efficiency (a measure of how much of the observed DoS traffic is mitigated by that signature). In our lab these values are both at or near 100%. In a real environment the Accuracy should be very high, but sometimes Efficiency will be lower (in a mutating attack) and the system may have to create additional signatures or refine the current one based on effectiveness.Click the new signature.
Note the Wireshark filter at the bottom which can be used in conjunction with the Record Traffic feature of F5’s L7 DoS to identify exactly which requests the signature matches/will match. This can be helpful if using the “Approved Only” in the DoS profile setting to allow a risk-averse administrator to approve signatures before they begin to filter traffic.
Change the Alias value to Agility2018, and then click Finished.
– View Silverline Signals
Use the Silverline portal to view details about the L7 DoS attacks that were launched in this exercise.
Click Alerts for Hybrid Defender.
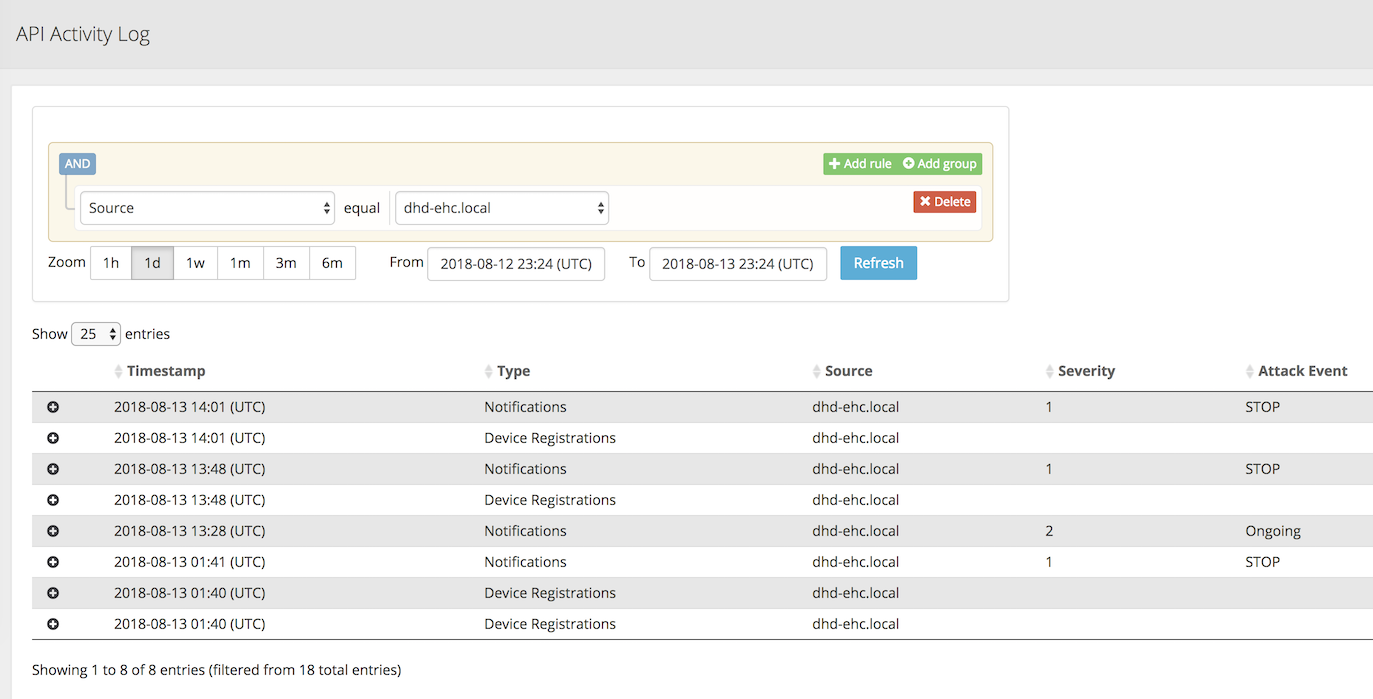
Open the Audit-> API Activity Log page.
Click the + icon to expand one of the entries to view additional attack details.
That completes the hands-on exercise for BIG-IP DDoS Hybrid Defender.